Dashboards: Create a home to visualise your key data
A one-stop shop to see all the metrics and data that matter.

Table of Contents
Dashboards help teams get a single view of all their crucial data in one engaging, visually compelling place. Building a bespoke one with a no-code tool might just make a lot of sense.
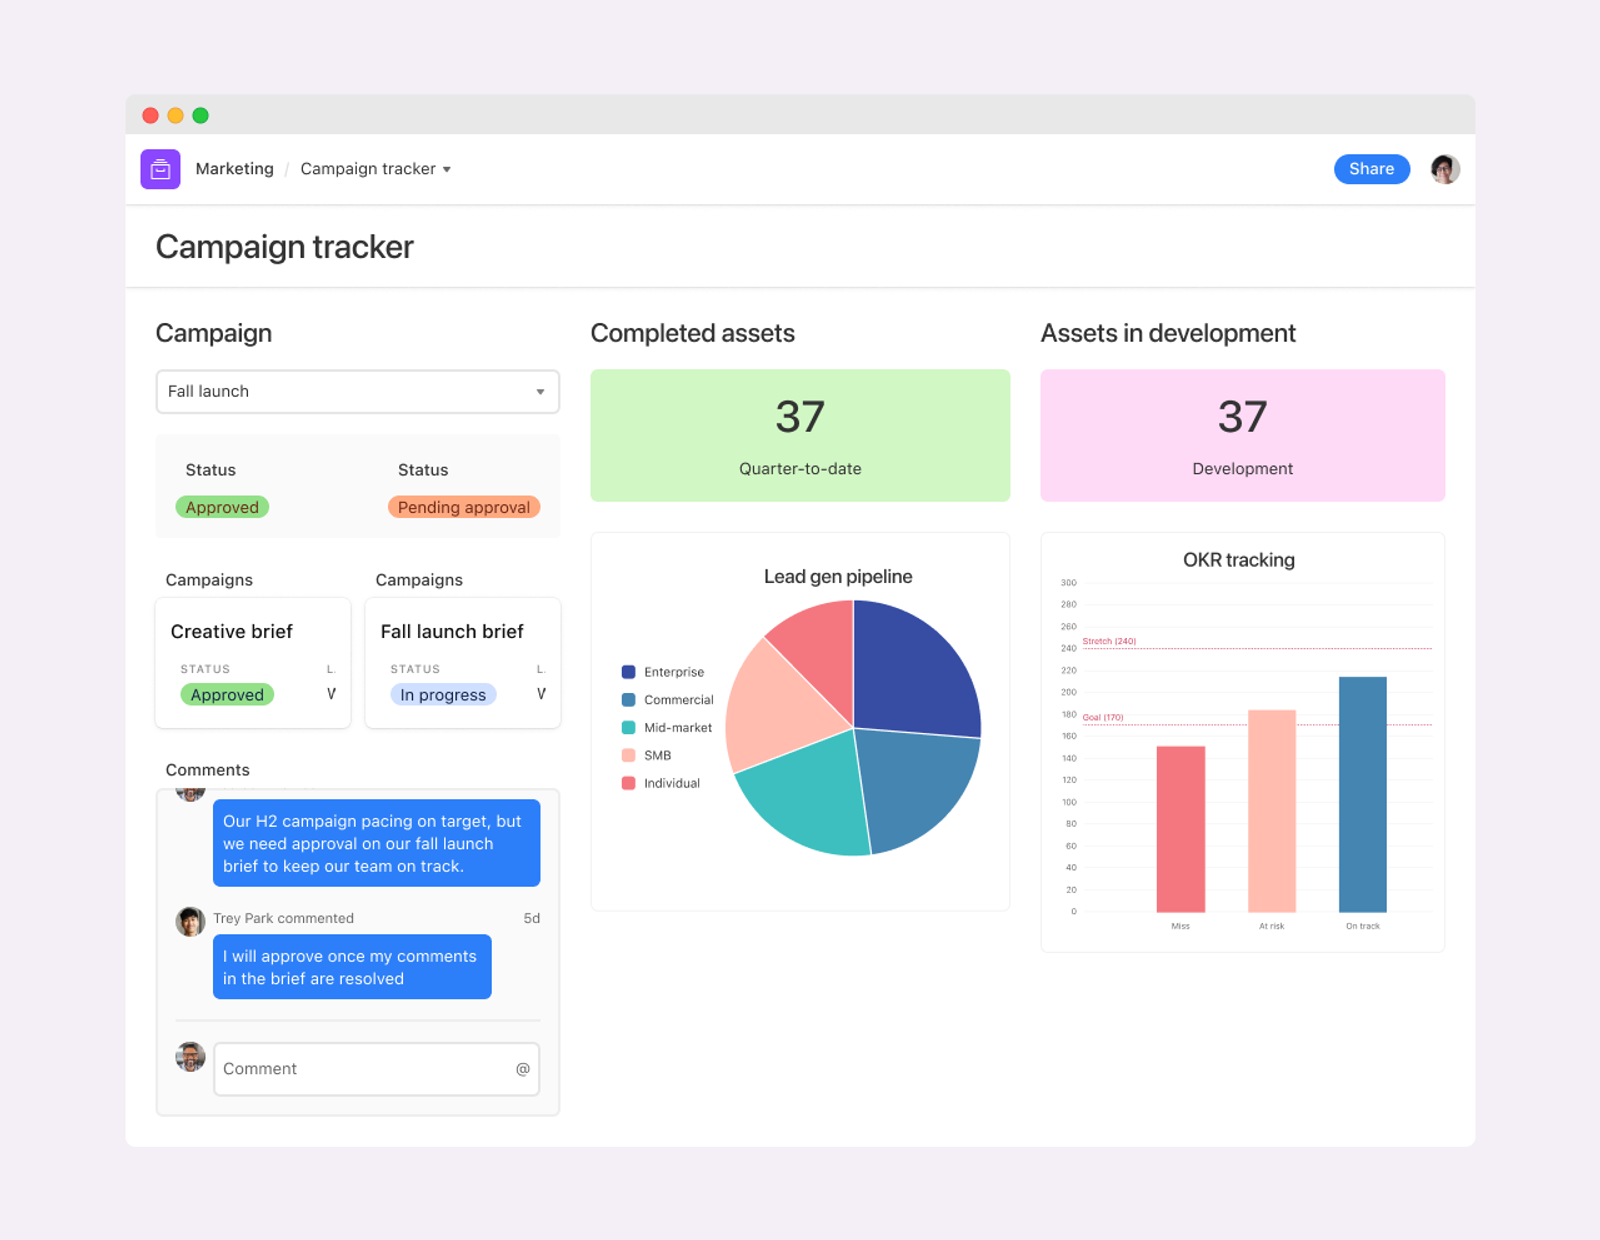
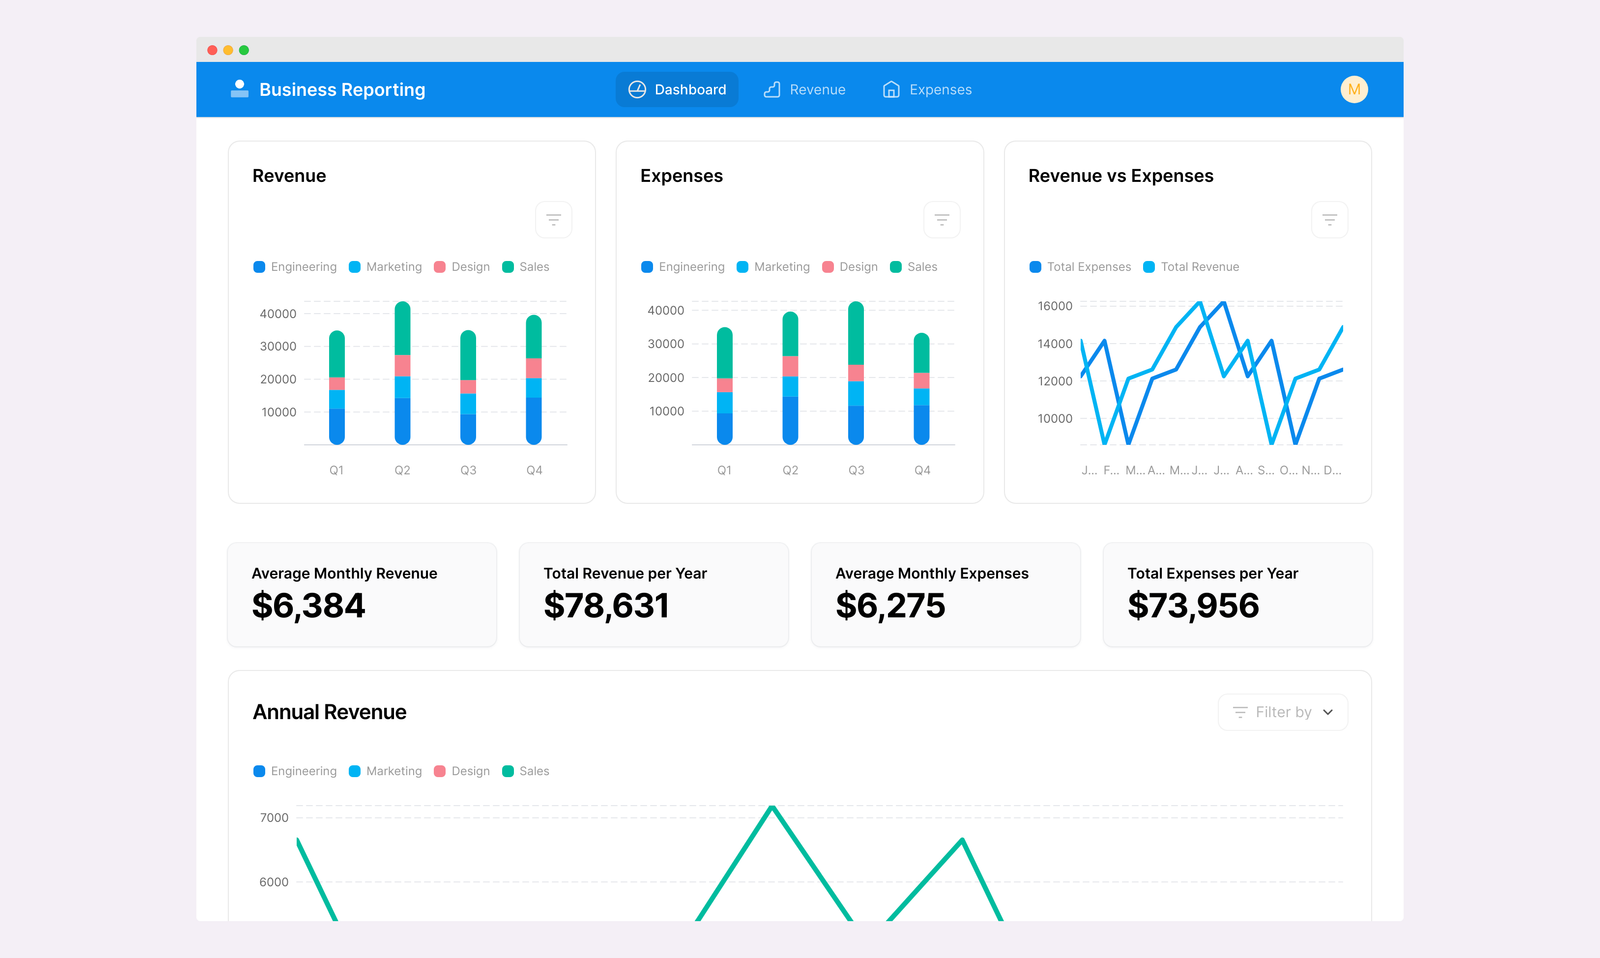
Do you often wish you could quickly see everything that’s happening with your team? How about making more informed decisions and predictions about what’s to come? Enter dashboards. They effectively bring together a bunch of data from different sources and display it in one easily accessible place using graphic visualisations.
They give teams and organisations one comprehensive view of all the metrics that matter – whether that’s customer satisfaction, revenue, inventory levels or any other performance measure. Creating bespoke, intuitive dashboards that are perfectly suited to your needs make accessing and analysing data a whole lot easier.
Wtf is a no-code dashboard?
As with most software, you’re left with a few choices when it comes to building a dashboard. You might get a team of developers to build you one from scratch, buy an off-the-shelf software tool with as much functionality as possible (eg, Tableau, Looker or Sisense), or build your own dashboard with no-code tools.
No-code dashboard builders basically allow you to build the exact functionality and interface you need to suit the specificities of your team or business. You can work with whatever data sources you might have (Excel, Google Sheets, Airtable…), lean on the platform's dashboard templates to get you started, and then go wild with customisation. You can customise the interface that works best for your team, taking into account the user experience, the design, privacy and access. The idea is you're able to make the simplest and most intuitive dashboard possible.
What problems can it solve?
- You can customise the interface to be exactly as you want it. The drag and drop design-builder of most no-code platforms basically means you’re able to create the exact interface you want. You can determine what appears on the dashboard homepage, which visualisations are used to display your data, and the different elements of your dashboard.
- You can take actions directly from within your dashboard. No-code platforms can connect to whatever data sources or apps you need them to. That means you’re able to take actions directly from within the dashboard – a huge benefit.
- You can bring all your data together. For that very same reason, you’ll be able to bring any data sources into your dashboard – whether that’s from a database or an API. That’ll enable you to analyse and keep track of things in a super seamless fashion.
- You can control who sees what. Another significant benefit of no-code platforms is the fact that they allow you to control, to a granular level, who can and can’t see certain parts of the dashboard. If there’s certain data that you only want managers to see, that’s easy to implement.
- You won’t need to ask for your IT department’s help. Following the no-code route basically removes the necessity to lean on your IT department. You’ll be able to self-serve: fixing problems and issues yourself and not having to wait for it to find its way to the top of their priority list.
Who needs to know?
Sectors:
Companies in every industry can benefit from dashboards, whether that’s financial services, retail, tech, construction or manufacturing.
Departments:
Dashboards are increasingly essential for pretty much every department in an organisation. Given how most departments rely on key performance indicators (KPIs) and need better visibility into important metrics, a no-code dashboard makes plenty of sense.
What’s the nuance?
- You need to know your objectives before you get started. Putting together a meaningful dashboard using no-code tools requires you to have some solid knowledge of the data you want to see and the goals you want to achieve. A great dashboard is a result of asking good questions and getting curious about the answers, so it helps to be familiar with the department or project that the dashboard will be used for.
- It’s a good idea to have a thorough understanding of your business. Likewise, you need an understanding of the business’s overarching goals and operations to make a dashboard that team members will actually use to get insights. It’s hard to make a dashboard when you don’t know what information you’re looking for.
- You need to be able to integrate data sources or have a database to work off of. Dashboards need data sources. So when it comes to choosing a no-code platform, you’ll obviously need to be sure you can integrate your data source with it. You can connect dashboards to your CRM, logistics software, your website, and any other system that generates data. In some cases, you may need to consolidate and sort the data before you can bring it into the dashboard.
- Knowing which visualisations to use can be tricky. Data visualisation is truly an art form. It might take some practice to figure out which types of data are best represented in which type of visualisation. Bar graphs and pie charts may work for some kinds of information, but not others. Tables can be overwhelming in some cases, but provide just the right depth of detail in others.
Which no-code tools are worth knowing about?
Beginners:
Airtable’s Interface Designer is a great option for those just starting out. It’s easy to sync data from anywhere to the dashboards you build and change how you view your data without disrupting the organisation of your database. You can also use their excellent templates to start building dashboards for tracking key metrics.
Intermediate:
Progressing from Airtable, if you want your dashboard to be able to access multiple data sources, Glide is the best option. It also has added functionality like allowing specific team members (like an executive team) to access dashboards from their phones.
Expert:
Internal.io is an enterprise business solution with a suite of data and analytics tools, including easy-to-build, no-code dashboards. For the experts and specialists dealing with a high volume of complex data, SaaS like Tableau are improving their no-code capabilities.
If you're looking to skip the design work entirely, tools like Stacker take a different approach: connect your existing spreadsheet or database and it automatically generates a polished, customer-facing dashboard or portal. No layout configuration, no component dragging — describe what you need and the AI builds the interface. For ops teams that already have their data in Airtable, Google Sheets, or Salesforce, it's the fastest path from data to dashboard.
If you're looking to skip the design work entirely, tools like Stacker take a different approach: connect your existing spreadsheet or database and it automatically generates a polished, customer-facing dashboard or portal. No layout configuration, no component dragging — describe what you need and the AI builds the interface. For ops teams that already have their data in Airtable, Google Sheets, or Salesforce, it's the fastest path from data to dashboard.
If you're looking to skip the design work entirely, tools like Stacker take a different approach: connect your existing spreadsheet or database and it automatically generates a polished, customer-facing dashboard or portal. No layout configuration, no component dragging — describe what you need and the AI builds the interface. For ops teams that already have their data in Airtable, Google Sheets, or Salesforce, it's the fastest path from data to dashboard.


